
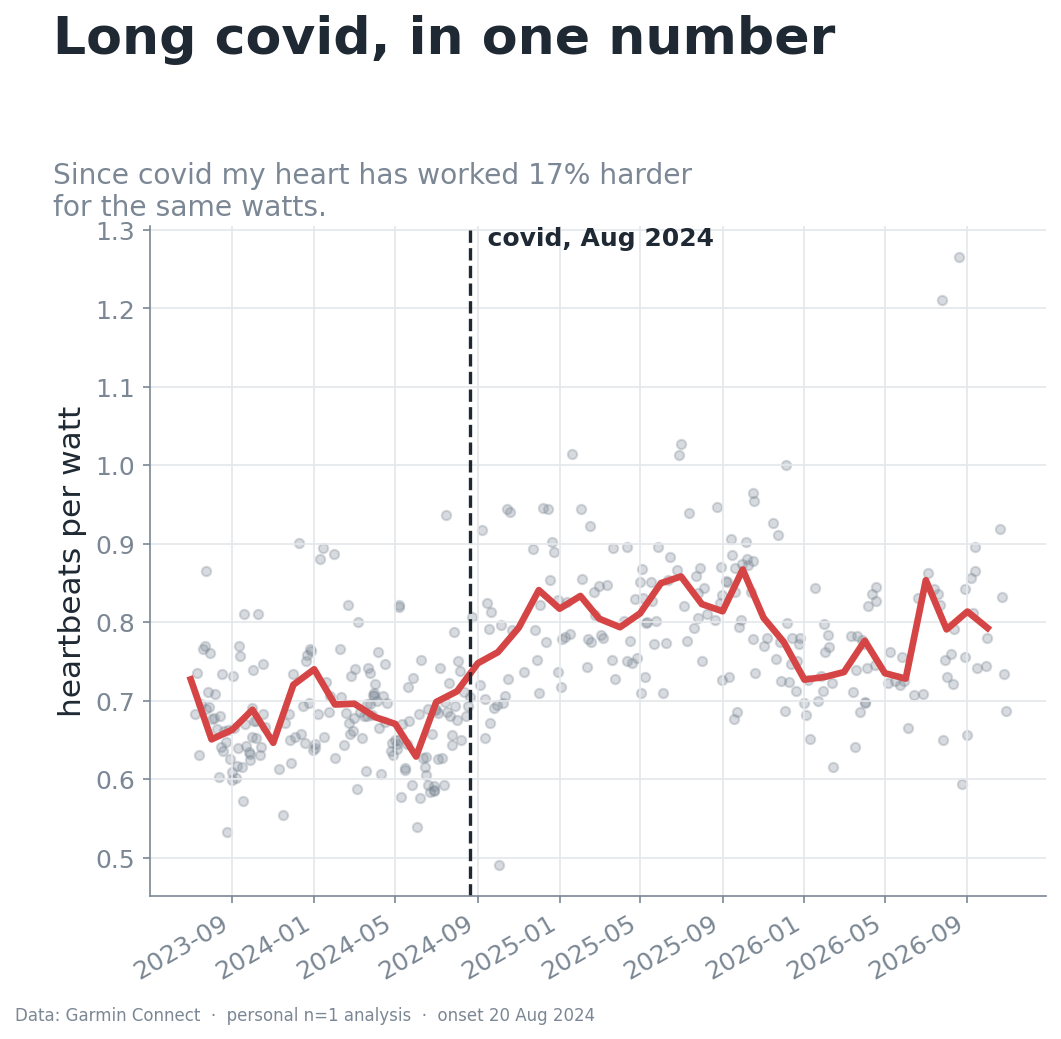
In my 2024 season wrap up I mentioned that I picked up COVID-19 a week before Ironman Canada, raced anyway and ended up walking 40km of the run. I finished that post with “just have to take it easy and hope time fixes it up”. Well, it’s been over two years and time hasn’t fixed it up. Rides that used to feel easy feel like work, my training fell apart and I’ve never really felt like myself since.
It wasn’t just the training either. For the first three months I had stabbing chest pains. I also started losing hair and developed an intolerance to alcohol. None of that shows up on a Garmin, so the rest of this post sticks to what does. I had endless medical diagnostic tests and every response was “you’re perfectly healthy”. Going from running half-marathons, unaffected, before work, to not being able to run more than 2km, overnight, is not “perfectly healthy”. The healthcare professionals I was seeing didn’t seem to blink at that information.
The frustrating thing about long covid is how invisible it is. You know something is wrong, but it’s hard to point at. The one thing I do have is three years of data sitting in Garmin Connect. Every ride, every run, every night of sleep and every morning heart rate. So I pulled it all out and asked a simple question: can you actually see long covid in the numbers?
Turns out you can.
I used the open-source garminconnect Python library to export about 1,440 activities and 1,200 days of health metrics, July 2023 to October 2026. Then I split everything at 20 August 2024, around when I got sick, which gives roughly one year before and two years after. Everything was analysed in Python with pandas, scipy and matplotlib. To be clear, this is one person’s data and not a medical finding, but it’s my data and it tells a pretty consistent story.
The first number is the one that stopped me. On the bike, power is an objective measure of work. 200 watts is 200 watts whether you’re fresh or otherwise. So heart rate divided by power tells you what it costs your body to produce that work. Before covid I averaged about 0.68 beats per watt across every ride, outdoor and Zwift. Since then the average is 0.80. That’s 17% more heartbeats for the same output. Running shows the same thing, with heart rate per unit of grade-adjusted pace up 13%.
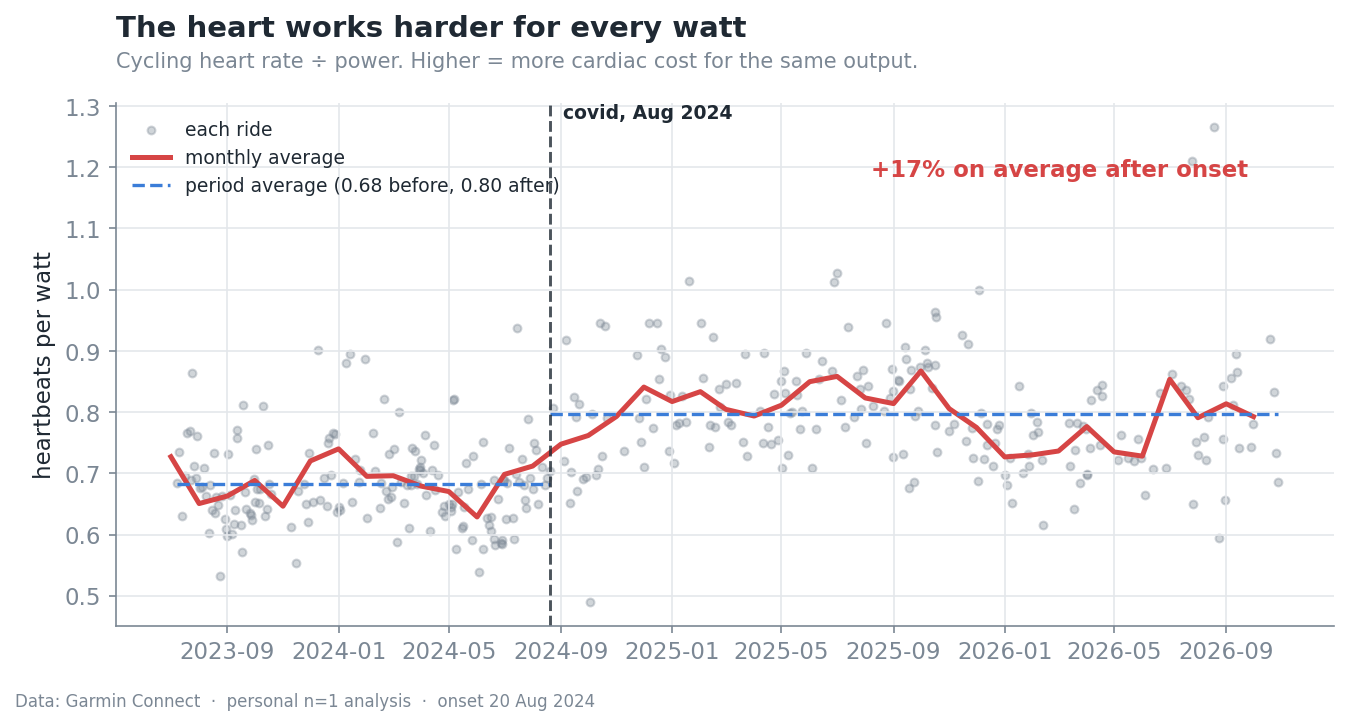
The monthly line starts creeping up through summer 2024, jumps after August and sat up around 0.8 to 0.85 for all of 2025. Early this year it dropped back to about 0.73 and I thought I was finally turning the corner, but over the summer it went straight back up above 0.8 and that’s where it’s been since.
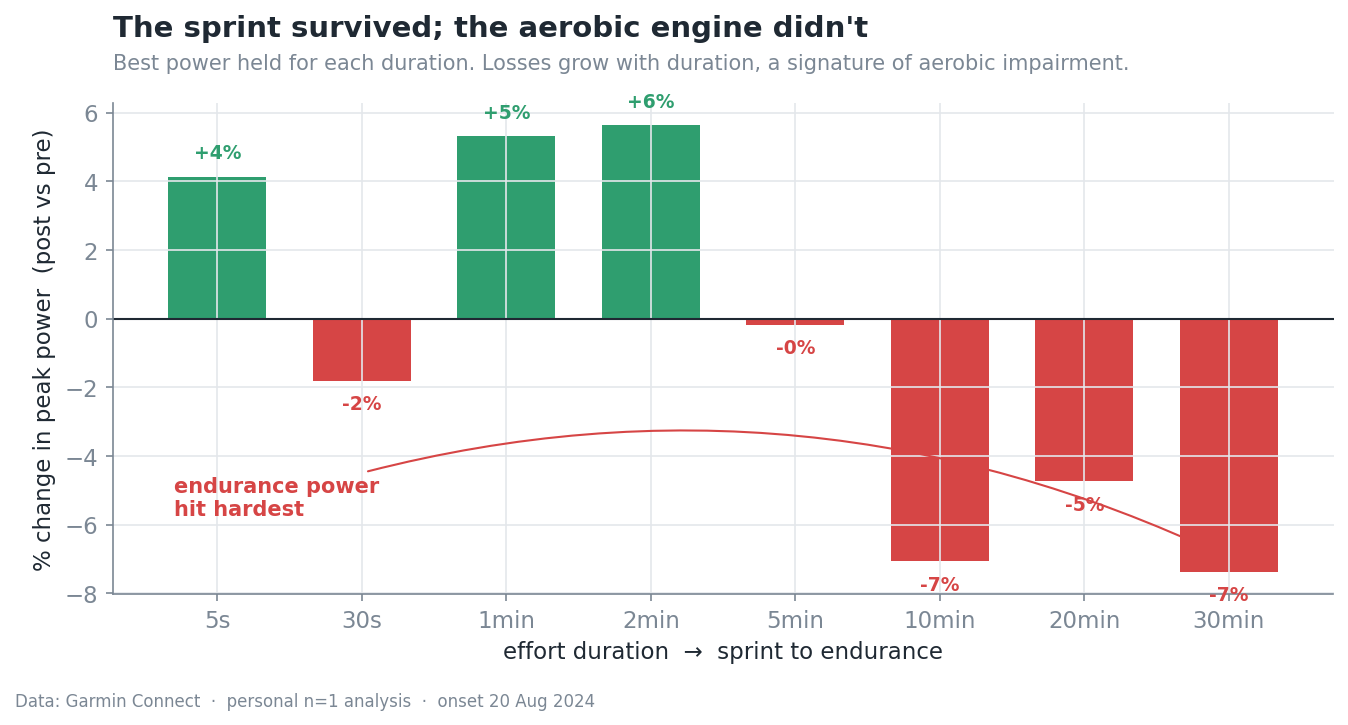
Next I looked at where the power loss actually landed. I pulled my best power for every duration from a 5 second sprint up to a 30 minute effort, before and after. Normally when you lose fitness you lose it everywhere. This was different. My sprint and 1 to 2 minute power are fine, about 5% up even. Five minutes is flat. Past that it all goes the other way, down 7% at 10 minutes, 5% at 20 minutes and 7% at 30 minutes. Top end intact, aerobic engine taking the hit. That points at oxygen delivery and the aerobic system, which is exactly what the heart rate per watt number was hinting at.
Then there’s durability. Aerobic decoupling is a metric endurance athletes use to see how well you hold up over a long steady effort. You split the session in half and compare the power to heart rate ratio between the two halves. If heart rate drifts up while power holds, you’re decoupling, basically running out of aerobic road. Under 5% is considered durable. I pulled the second-by-second data for 375 long rides and runs (45 minutes or more) and calculated it for each one.
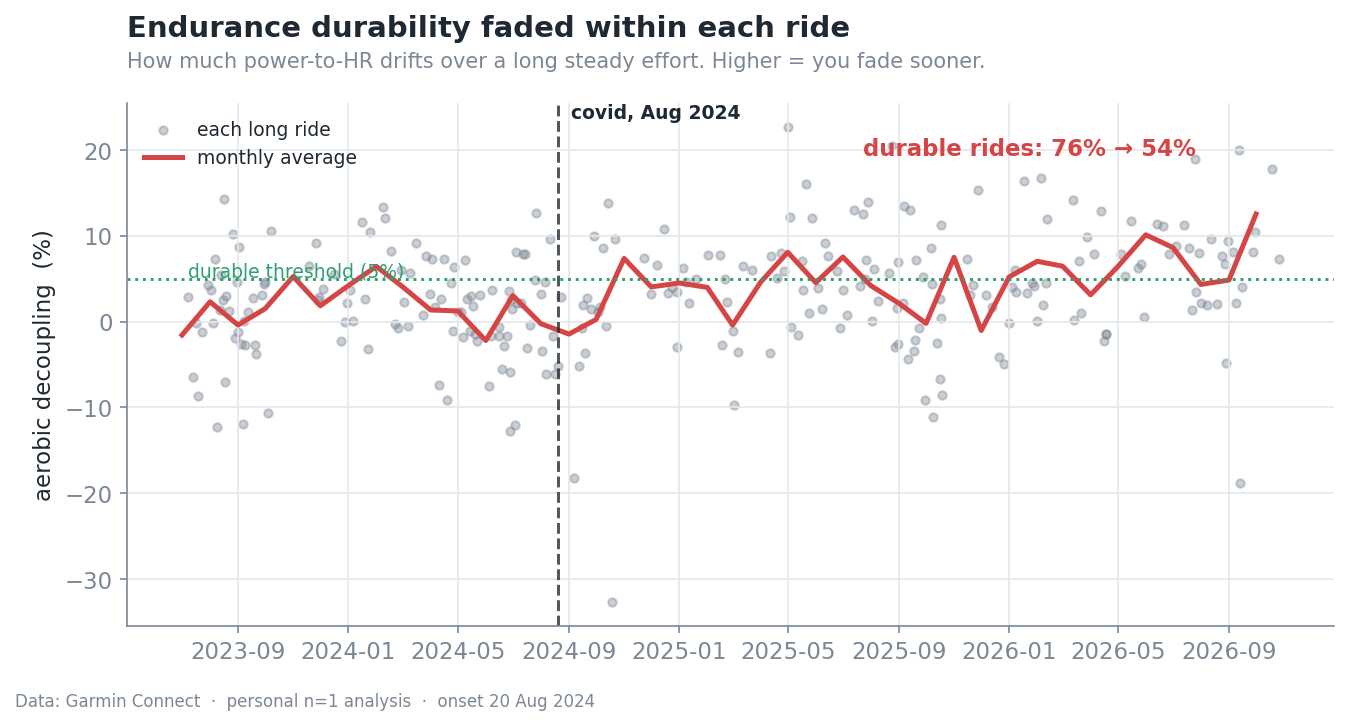
Before covid my cycling decoupling averaged 1.5%, rock solid. After, it’s 4.2%, more than double. The share of long rides that stayed under the 5% line dropped from 76% to 54%. So not only is there less fitness to begin with, I’m burning through it faster within each ride. The nice thing about this one is that it compares me against myself inside the same ride, so it can’t be blamed on weight, weather or a new watch.
There’s a well known trio of long covid signatures in wearable data: resting heart rate up, HRV down and VO2max down. I’ve got all three. Resting HR is up a couple of percent (it was already very low, around 44), HRV dropped 13% from 48 to 42 ms and VO2max dropped from 51 to 48.
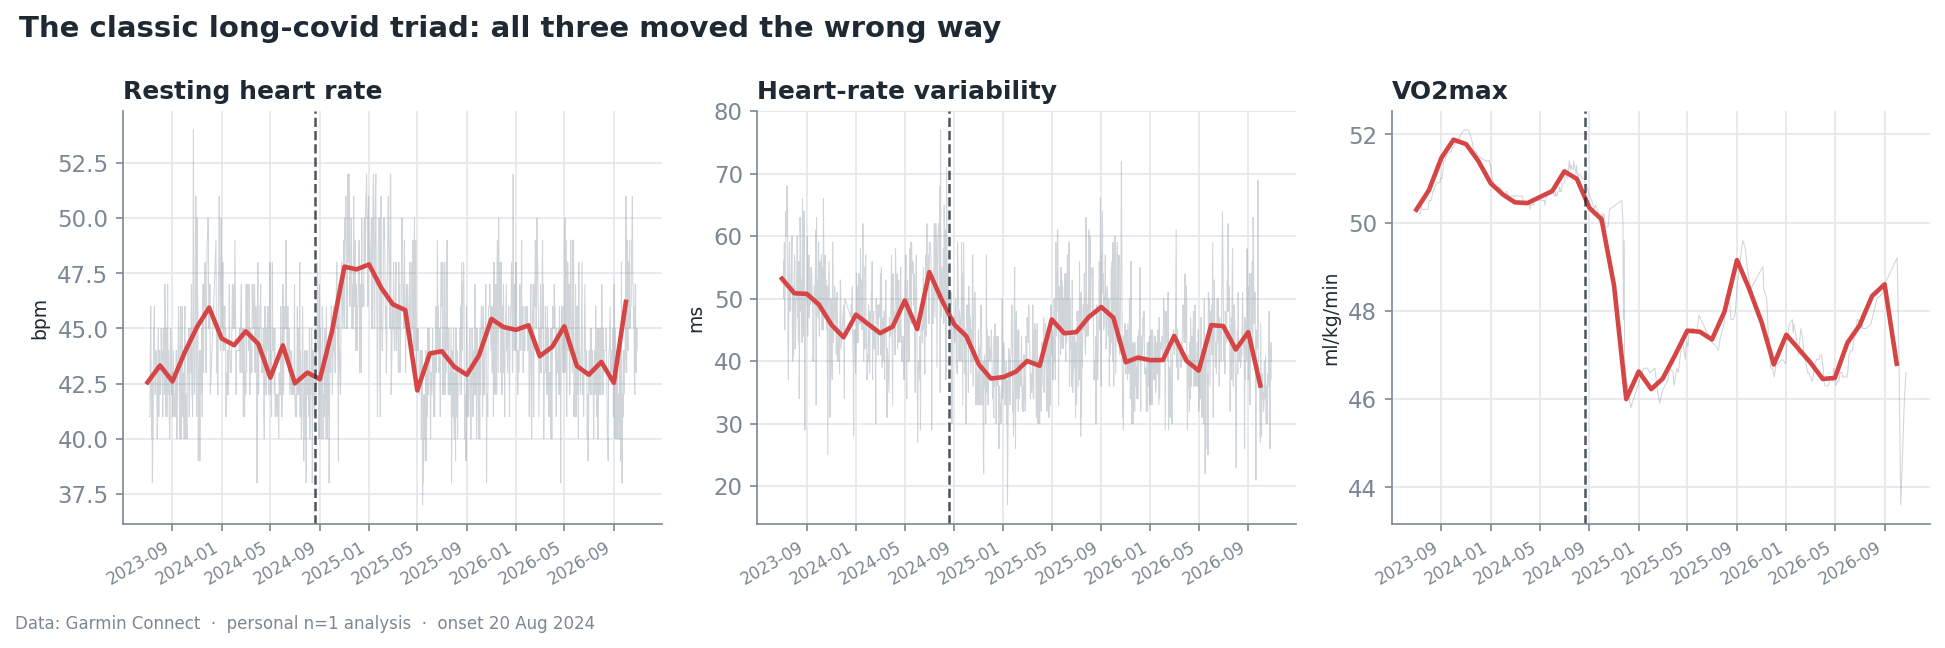
The obvious argument is that I’m just comparing a good summer to a bad winter. So I reran it month matched, comparing each calendar month only with the same month on the other side of August 2024. It barely changed anything, HRV still down 12% and VO2max down 7%. It’s not the season. Garmin’s own race predictions agree too, they have me 15 to 22% slower across every distance from 5km to the marathon, and my endurance score is down 18%.
Swimming didn’t seem too affected but it’s hard to tell with a wrist-based heart rate monitor in the pool. What did change is everything around the swimming.
Garmin also estimates my lactate threshold from my runs. At my best in 2024, before I got sick, my threshold pace was 4:35/km. At its worst in 2025 it was 5:13/km, about 14% slower. The weird part is my threshold heart rate actually went up, from 165 to 169. So I’m hitting threshold at a higher heart rate while running slower, which is the running version of the heartbeats per watt problem.
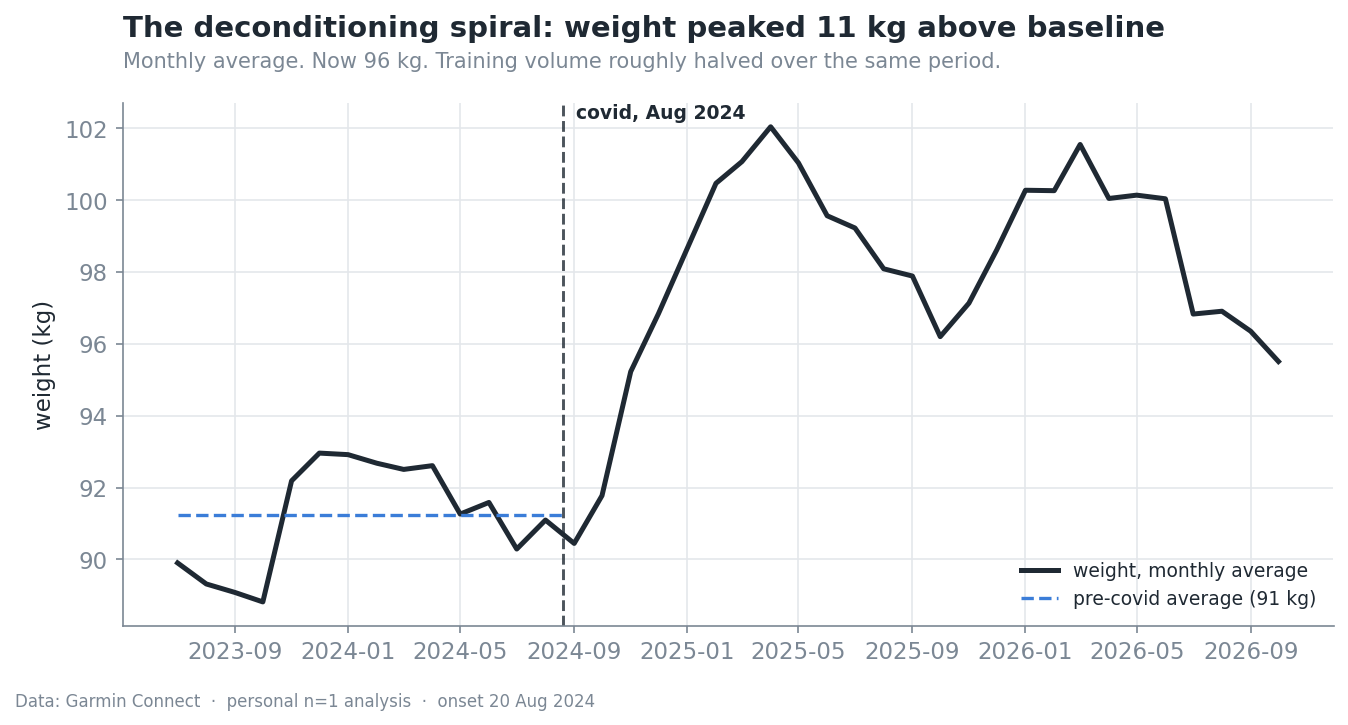
My training volume roughly halved, from about 50 hours a month to about 30. Garmin’s chronic training load says the same thing, down 55%. My body changed with it. My weight went from around 91kg to a peak of 102kg in early 2025. It’s a bit of a spiral. I trained less because I was exhausted and trying to not push things too hard so that I could recover, the extra weight made everything harder, and around it goes. It was also hard mentally, going out for an easy run and having my body stop me after 2km, knowing the fitness level I had come from, and it really took a toll. I’ve dropped about 6kg since the spring and I’m sitting around 96kg now. I don’t think the weight explains the running though. Before covid I was putting down some fast runs at around 93kg, and back then my heart rate for a given pace was about 12% lower than it is now. Dropping from 100kg to 96kg this year hasn’t moved that number at all.
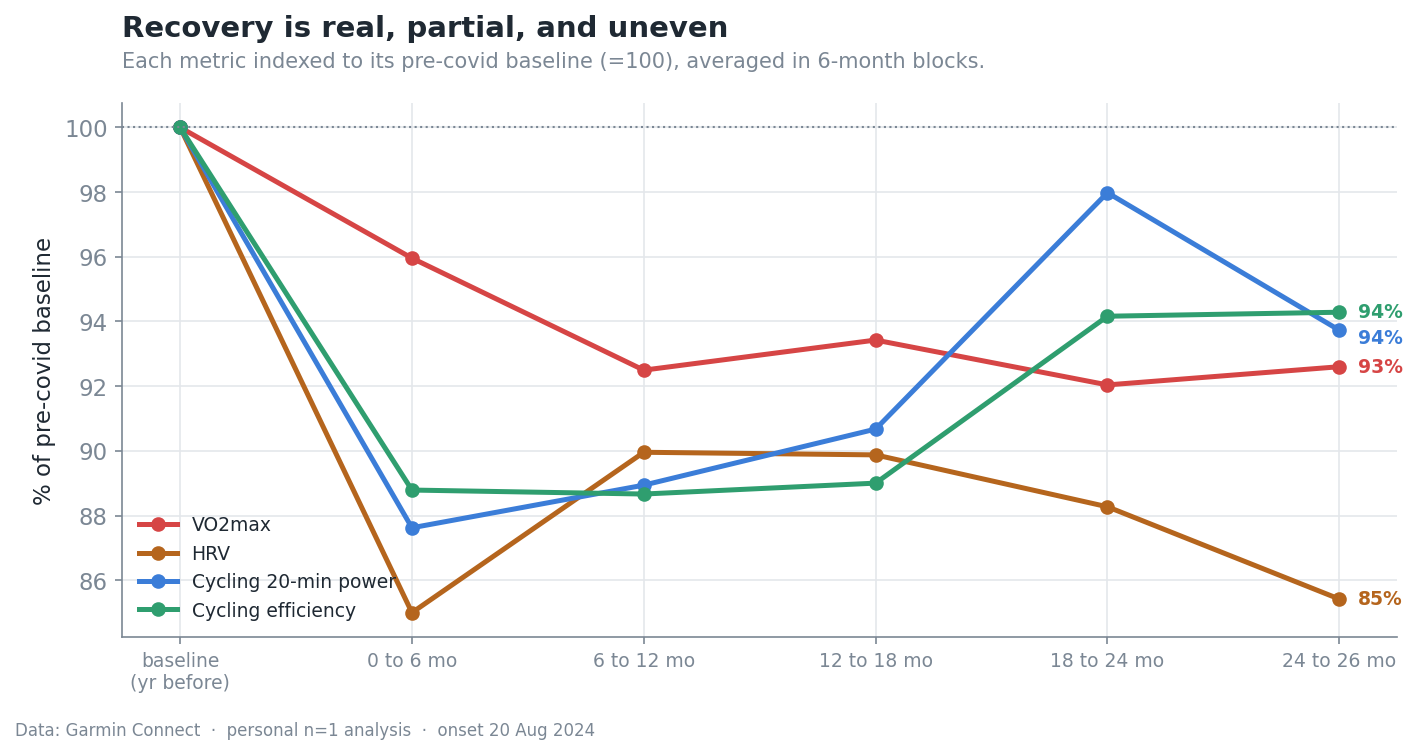
So am I getting better? It’s not a straight line. I indexed a few metrics to their pre-covid baseline and tracked them in 6 month blocks. Between 18 and 24 months after getting sick, my 20 minute power was back to 98% of where it was and cycling efficiency was up to 94%. I genuinely thought I was nearly there. Then the last couple of months slipped backwards, with 20 minute power back down to 94% and efficiency stuck at 94%. VO2max has barely moved at 93% and HRV has kept sliding, now down to 85%. October has been my lowest HRV month in the whole three years. Decoupling has crept up this year too, so the durability side isn’t fixed either.
There were also a few things the data couldn’t tell me. Overnight blood oxygen looked like it improved after covid, but my watch didn’t log SpO2 at all in 2024 and started again on newer hardware in 2025, so that result is really just old watch vs new watch. Respiration rate has the same problem, so I threw both out. I also tried to find post-exertional malaise by checking whether hard days hurt my next morning HRV more after covid than before. It didn’t show up cleanly, mostly because I was training so much easier that a “hard” day doesn’t mean what it used to.
On the stats side, I compared before and after with Welch’s t-tests and Cohen’s d effect sizes. Daily wearable data is correlated day to day, which makes p-values look more certain than they really are, so I leaned on the effect sizes and the trends you can see in the charts rather than the p-values alone.
The most validating part of all this wasn’t any one number. It was seeing a bunch of metrics from completely different systems all point the same way and all turn at the same point in August 2024. Heart working harder, aerobic ceiling lower, durability fading, HRV down and weight up. That’s not a bad month of training, that’s something that happened to me with a date attached to it.
The good stretch earlier this year gives me some hope that it can come back, and the slide since keeps me honest. Now that I’ve got the baseline mapped out, I’ll be able to see it in the data when I do properly turn the corner.
I am now also able to run more than 2km without stopping. Currently at about 8km, but things really do get tough at anything more than 5km. If you’re dealing with long covid and have a Garmin, I’m happy to share the scripts. Drop a comment below!